Sponsored Ad: Click Here to Open a Share Trading Account Online for FREE and Pay ZERO Brokerage to Buy and Sell Shares!!!
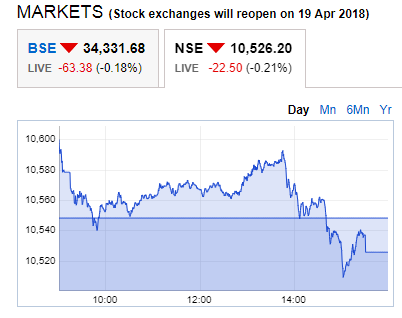
Today 18-Apr-2018 was a non-trending day for stock markets. See this pic:
See the pic clearly. Till 1.45 pm all intraday traders must be long trying to make quick bucks. But then what happened?
STOP LOSS
I can bet ALL TECHNICAL INDICATORS – those 5 min charts, 15 min charts, 1 hours charts, candle sticks, bollinger bands, Moving average convergence divergence (MACD), and any other indicator that I am missing must be giving only one signal
GO LONG
And then when the trader goes long thanking the technical indicators, the software that they bought for a few lakhs or paying a monthly fees goes bust (fails) all of a sudden.
Can you kick your software? Are they to be blamed? NO. Then whom to blame? Yourself.
What makes you believe that the 5 min charts that only gives signals based on last 5 minutes will be correct for the next 5 minutes? Or one hour chart giving signals based on last 1 hour will be correct for the next 1 hour.
What about a stock giving great return for the last 1 year? Is there a gurantee that it will give the same return in next 1 year? NO.
Technical Indicators just give signals based on whats happening NOT what will happen.
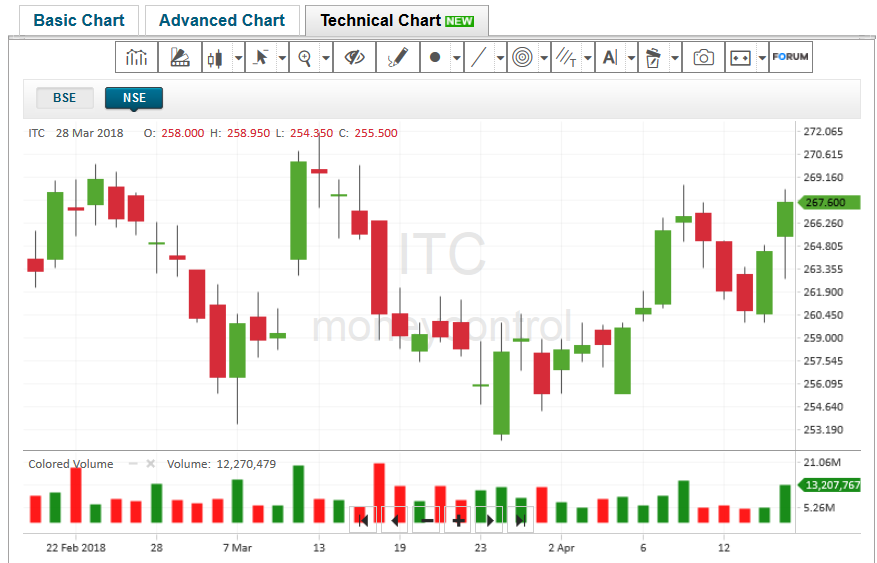
Stop spending money on software producing beautiful charts. If you still do not believe me and want to stick to charts moneycontrol makes free charts.
Here is ITC Technical Chart:
Source:
http://www.moneycontrol.com/india/stockpricequote/cigarettes/itc/charts/technical-chart-analysis/ITC

Click to Share this website with your friends on WhatsApp
COPYRIGHT INFRINGEMENT: Any act of copying, reproducing or distributing any content in the site or newsletters, whether wholly or in part, for any purpose without my permission is strictly prohibited and shall be deemed to be copyright infringement.
INCOME DISCLAIMER: Any references in this site of income made by the traders are given to me by them either through Email or WhatsApp as a Thank You message. However, every trade depends on the trader and his level of risk-taking capability, knowledge and experience. Moreover, stock market investments and trading are subject to market risks. Therefore there is no guarantee that everyone will achieve the same or similar results. My aim is to make you a better & disciplined trader with the stock trading and investing education and strategies you get from this website.
DISCLAIMER: I am NOT an Investment Adviser (IA). I do not give tips or advisory services by SMS, Email, WhatsApp or any other forms of social media. I strictly adhere to the laws of my country. I only offer education for free on finance, risk management & investments in stock markets through the articles on this website. You must consult an authorized Investment Adviser (IA) or do thorough research before investing in any stock or derivative using any strategy given on this website. I am not responsible for any investment decision you take after reading an article on this website. Click here to read the disclaimer in full.

My student gets the Winner's Certificate of Zerodha 60-day Challenge - Click here and Open Stock Buy and Sell Free Account with Them Today!!!


 Testimonial by a Technical Analyst an Expert Trader - Results may vary for users
 60% Profit Using Just Strategy 1 In A Financial Year – Results may vary for users

 Testimonial by Housewife Trader - Results may vary for users