≡ Menu

This is the most common problem with traders, especially the new entrants. No, actually the problem is widespread. Even experienced traders find it hard to control greed and fear while trading.

I remember one person who is my client told me once that he made 2 crore profit from almost the same investment and then lost approx. 3.5 crore and is now left with 50 lakhs.

So what destroyed his wealth? Greed not Fear.

What is an example of fear destroying wealth in stock markets?

It is more prevalent among mutual fund investors. When stock markets tumble they either stop their SIP or just withdraw all money in fear from their mutual fund investment.

Similarly, a trader in fear takes out a small profit when he could have made more just by waiting a few hours and when it comes to losses; they let the losses run in hope for a reversal. They do not cut short their losses in fear that if they do, they will lose money.

Ultimately expiry comes and they end up losing four times the profit made in last trade.

With a proper plan you can control greed and fear, but do you plan before a trade? Or still, speculate?

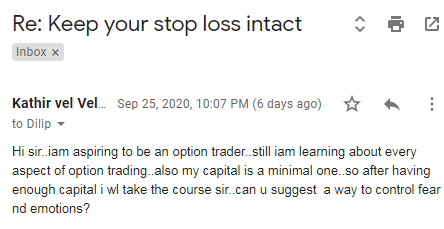
Here is one email that I received a few days back which is asking the same thing – how to control greed and fear.

Kathir-email

How to Control Greed & Fear?

1. Never over trade. If you have 5 lakh in your trading account any trade you take must be with a stop loss of 1% of the entire capital in your account. Which means even if you trade with 1 lakh out of that 5 lakh, you must ensure that the max loss that you can take is 5000. Make sure you do not take more than 1% loss of your entire capital. This way if you win even 50% of the times – you will stay in the game for long.

2. If you lose you lose, do not get into revenge trading to get back the money lost.

3. 10% per month is simply not possible for long time. If you over trade you may lose 10% a month but not make 10% a month.

4. Fear taking naked trades. Means never take any un-hedged position in either options or futures. If you hedge your trade then the fear of losing too much money will automatically goes as hedging ensures you lose less. All the strategies in my course include hedging.

5. If you made huge money in one trade do not risk all that money in the next – you will lose all. So even if you are a good trader and doing good most of the times – keep 1% stop loss rule intact for your entire account across different segments and for your entire trading career.

If you follow the above rules you can overcome greed and fear.

{ 0 comments }

Data Patterns IPO Subscription Details:
 
IPO Opening Date: Dec 14, 2021
IPO Closing Date: Dec 16, 2021
Issue Type: Book Built Issue IPO
Face Value: ₹2 per equity share
IPO Price: ₹555 to ₹585 per equity share
Market Lot: 25 Shares
Min Order Quantity: 25 Shares or multiples of 25
Listing At: BSE, NSE
Issue Size: Eq Shares of ₹2 (aggregating up to ₹588.22 Cr)
Fresh Issue: Eq Shares of ₹2 (aggregating up to ₹240.00 Cr)
Offer for Sale: 5,952,550 Eq Shares of ₹2 (aggregating up to ₹348.22 Cr)
Qualified Institutional Placement (QIP) Shares Offered: Not more than 50% of the offer
Retail Shares Offered: Not less than 35% of the offer
Net Interest Income (NII) (HNI – High Net Worth Individual) Shares Offered: Not less than 15% of the offer
 
Net interest income = Interest earned – interest paid by the banks or financial institutions.
 
Update on 14-Dec-21 @ 12.45 pm:
 
GMP (Grey market Price) today is ₹610 which means the grey market is expecting shares of Data Patterns to list around ₹1195 ( ₹585 + ₹610), believe market observers.
 
This means investors may benefit from listing gains.
 
About the Company
 
Data Patterns is one of the few vertically integrated defence and aerospace electronics solutions providers catering to the indigenously developed defence products industry. It has proven in-house design and development capabilities, with experience of over three decades in the defence and aerospace electronics space. Data Patterns offers the entire spectrum of defence and aerospace platforms – space, air, land and sea. The company offers a wide range of products, including COTS modules, avionics displays, and communications ATES and satellites, fire control and other electronic systems for BrahMos and electronic warfare surveillance systems and radars. As of Sept’21, it has 818 employees with more than 500 qualified engineers, including 416 members in the design & engineering department. Its manufacturing facility consists of a 100,000 sqft factory built on 5.75 acres of land in Chennai, which has facilities for design, manufacturing, qualification and life cycle support of high-reliability electronic systems used in defence and aerospace applications. The order book as of Sept’21 stood at Rs5.8bn, with orders from several marquee customers in the Indian defence ecosystem, including the Indian defence ministry, BrahMos, DRDO, the Indian Space Research Organisation, HAL, BEL and a DPSU involved in the missile space. Data Patterns continues to invest in the development of various platform-specific products that have an annuity requirement, thus ensuring continuity of business in the coming years. It has received an annuity order for Rs120mn for the design and supply of cockpit displays for the Light Utility Helicopter (LUH), which has significant potential to generate additional annuity revenues from the new units required for the larger number of LUHs planned by HAL. Data Patterns has started to focus on civilian requirements like nano-satellites, wind profile radar and also plans to expand its export business, which is 10-12% of the core business currently.
 
Financials in Brief
 
During FY19-21, its revenue and PAT clocked 31% and 169% CAGR respectively, while average RoE and RoCE stood at ~15% and ~18%, respectively. During FY18-21, its order book clocked 41% CAGR to Rs4.9bn in FY21, which further expanded to Rs5.8bn in 1HFY22. The company enjoys a higher gross margin and EBITDA margin of 68.6% and 41.1% respectively, which are the highest among the key defence and aerospace companies. The order book as of Sept’21 stood at Rs5.8bn (3x FY22 annualized revenue), of which 67% share comes from production, 22% from development and balance 11% from services.             
 
My View: SUBSCRIBE
 
On FY22 annualized financials, the IPO is attractively valued at 40.7x EV/EBITDA, 16x EV/sales and 65.4x P/E vs. Paras Defence’s 68.9x EV/Sales and 19.7x EV/Sales and 157x P/E. The total addressable market is expected to grow from $1.97bn in CY20 to $6.65bn in FY30E, with a CAGR of 9%. The opportunities in the Indian defence sector is seen strong at $65bn in FY22. The company is looking to expand its product portfolio and focus on repeat large-volume production orders. Furthermore, it expects to augment design and development capabilities and increase its revenues by leveraging core competencies and growing its services and exports business. Data Patterns has a healthy order book of Rs5.8bn (3x FY22 annualized sales), providing revenue visibility over the medium term. Because of the strong financials, the healthy order book of 3x, strong track record of delivery, unmatched competency model & technology and attractive valuation, we recommend SUBSCRIBE to the issue with a long-term perspective.
 
Source: Research done on various financial websites and written here.

{ 0 comments }

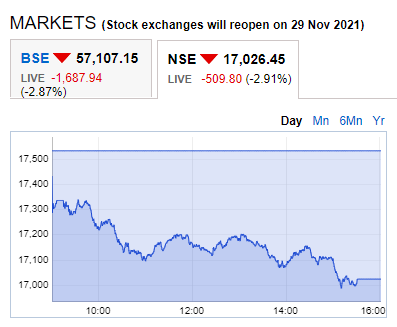
A lot of investors panic when the markets fall and start selling their stock holdings – this leads to even more drastic fall. This is what happened on Friday, 26-Nov-21. When the markets falls do not worry – not a single company fundamentals changed in the last 24 hours – it takes time. So why take your investments out when only one bad news of a new variant of COVID was found, that too in Africa.

See the NSE fall in 26-Nov-21:

NSE on 26-Nov-21

Very soon the clever investors will start investing and markets will rebound. They look a fall as an opportunity to buy not sell. But these kinds of investors are less. Panic investors never make money – it’s the clever investors who wait for an opportunity and get in and make money.

If you are also a long term investor do not to take a stop loss and unnecessarily take a loss when external news has hit which has nothing to do with the markets. Take a loss in an investment only when the company fundamentals has deteriorated. Otherwise, be invested and keep patience – in the long term eventually you will profit.

{ 0 comments }

Before reading you should know that in India Government is planning to move a bill to ban all private cryptocurrencies. So be careful before investing in any crypto currency, if banned you may not be able to sell the cryptocurrencies that you bought..

For the last few years, BITCOIN And Crypto Currency Trading is making a lot of news. Investors especially in the western countries, and now in India too have shown a lot of Interest in BITCOIN And Crypto Currency Trading.

What is BITCOIN?

Bitcoin is a new currency that was created in 2009 by an unknown person using the alias Satoshi Nakamoto. Transactions are made with no middlemen – meaning, no banks! There are no transaction fees and no need to give your real name. Some merchants in a few countries especially the USA are beginning to accept them. You can buy Webhosting services, pizza or even manicures using BITCOINS.

Why Bitcoins?

Bitcoins can be used to buy merchandise anonymously. In addition, international payments are easy and cheap because bitcoins are not tied to any country or subject to regulation. Small businesses may like them because there are no credit card fees. Some people just buy bitcoins as an investment, hoping that they’ll go up in value. Plus Bitcoins have shown strong growth in the last few years. Merchants accept them at the current rate hoping to cash the benefits years later, though there is risk involved.

Acquiring Bitcoins

Buy on an Exchange: Several marketplaces called “bitcoin exchanges” allow people to buy or sell bitcoins using different currencies. Here is a list of the top crypto currency exchanges.

Can You Trade BITCOIN in India?

Yes, you can. There are brokers who allow you to trade BITCOIN and Crypto Currency in India but it’s not recommended to trade because the Indian Government is planning to move a bill to ban all private cryptocurrencies. So be careful before investing in any crypto currency, if banned you may not be able to sell the cryptocurrencies that you bought..

Update on 08-Feb-2022:

The Reserve Bank of India (RBI) will introduce the Central Bank Digital Currency (CBDC) as India’s official digital rupee in 2022-23, finance minister Nirmala Sitharaman announced in the Union Budget for 2022-23. The announcement comes after months of speculations around the introduction of a blockchain-based official digital currency of India.

Source:
https://www.livemint.com/budget/news/budget-rbi-to-launch-central-bank-digital-currency-in-fy23-11643699585723.html

Though I personally am against this decision as I see value investing in financially strong companies, and low risk hedged options and futures trading as the best and low-risk ways to make money from the stock markets, there is nothing I can do except teaching readers of my website not to trade this high-risk investment.

You can, of course, buy cryptocurrencies for the long term, just like an investment in stocks, but my suggestion is not to trade on that.

There are many other reasons not to invest or trade in BITCOIN and CryptoCurrency. Here are they:

Reason 1 not to trade BITCOIN:

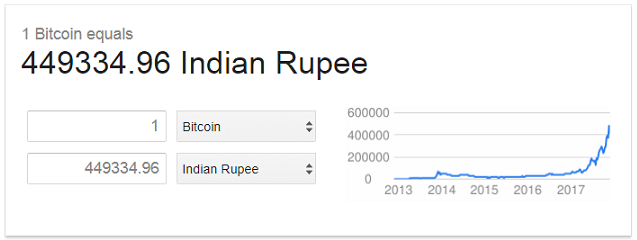
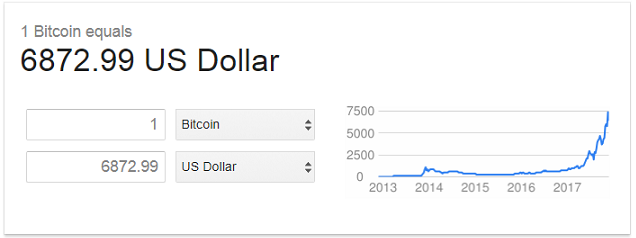
Look at BITCOIN price in Rupees as of 15-Nov-2017 time 12.25 pm India Time:

BITCOIN to INR

BITCOIN to INR

In other words, 1 BITCOIN equals ₹ 4 lakh, 49 thousand, 334.96 as of on 15-Nov-2017 time 12.25 pm India Time. Will you risk that much money to buy just 1 BITCOIN? At least I will NEVER.

BITCOIN price in USD as of 15-Nov-2017 time 12.25 pm India Time:

BITCOIN to USD

BITCOIN to USD

After 4 years BITCOIN prices:

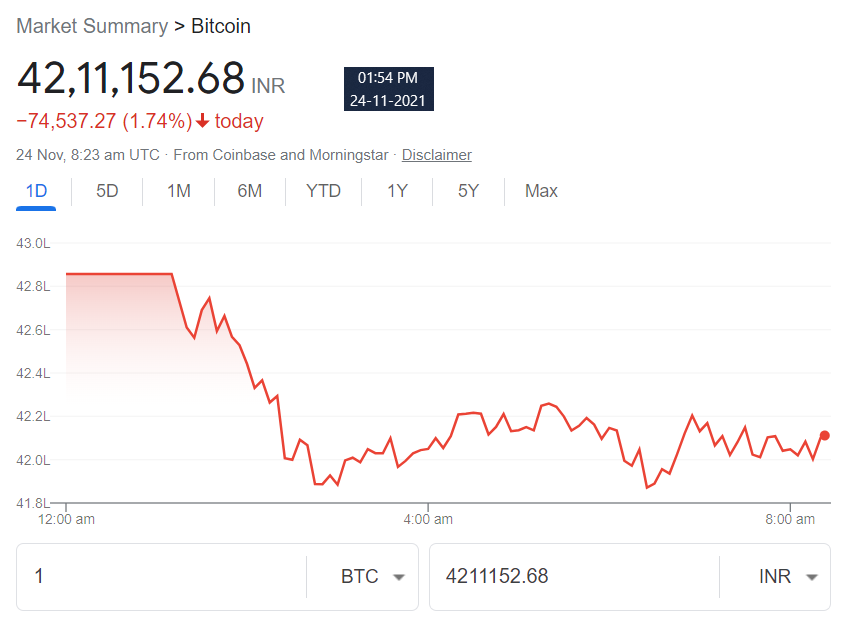
Look at ONE BITCOIN price in Rupees as of 24-Nov-2021, time 1.54 pm India Time:

In other words, 1 BITCOIN equals ₹42,11,152.68. Or ₹42 lakh, 11 thousand, 152.68. Will you risk that much money to buy just 1 BITCOIN? At least I will NEVER.

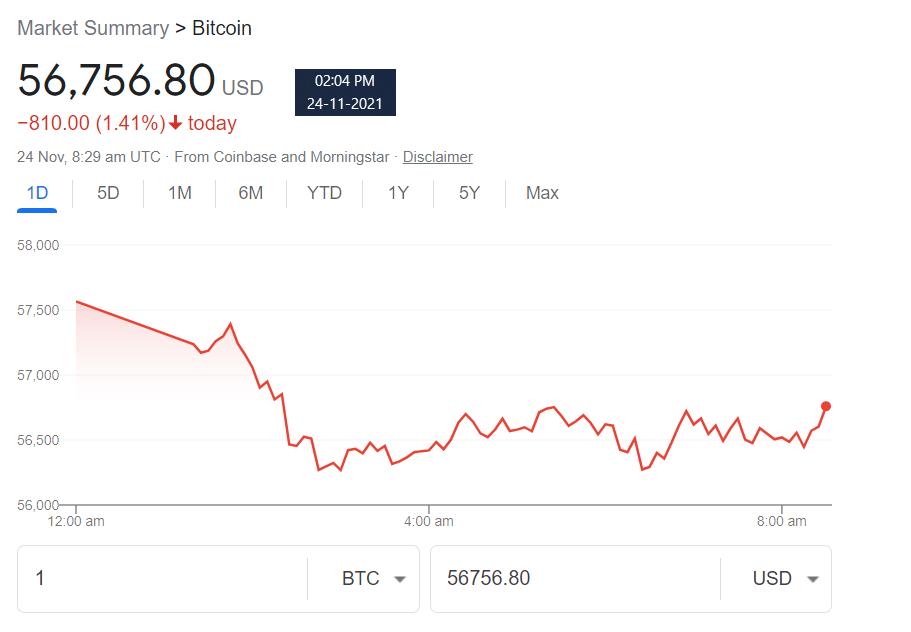
BITCOIN price in USD as of 24-Nov-2021 time 2.04 pm India Time is USD $56,756.80:

Agreed in 4 years ₹ 4 lakh, 49 thousand, 334.96 becomes ₹ 42 lakh, 11 thousand, 152.68. This is an ROI (Return on Investment) of 837.19%. This is huge but I bet you will not find a single person on earth who bought BITCOIN in 2017 and held it until 2021.

Update on 08-Feb-2022:
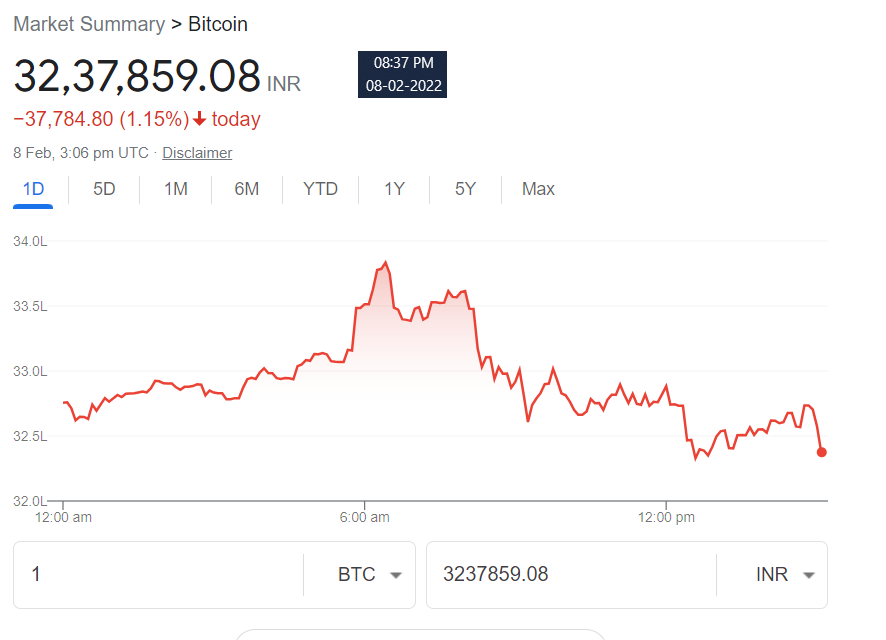
Price of BITCOIN in INR on 08-Feb-2022 is ₹ 32,37,859.08:

Bitcoin price in INR as on 08-Feb-2022

42,11,152.68 – 32,37,859.08 = ₹ 9,73,293.60. That is over Nine Lakh drop in just 3 months. WHAT A DROP in just THREE MONTHS!!! And this in just One BITCOIN.

Reason 2 not to trade BITCOIN:

On 15-Nov-2017, this is what I see in most BITCOIN trading websites:

₹ 4,86,800.00 BUY
₹ 4,84,000.00 SELL

If you buy and decide to sell straight away you are set to lose ₹ 2800 + brokerage (though brokerage is low and there is no tax as BITCOIN is not controlled by governments).

Reason 3 not to trade BITCOIN:

Most people do not understand BITCOIN, so it is better not to invest in a business that you do not understand. Moreover, governments all over the world are against it. Read this:

Governments will eventually defeat cryptocurrencies.

Big Governments Are Crushing Cryptocurrencies

So you don’t know what LAW will KILL BITCOIN & Crypto Currency Trading. The day governments kill it all your investments become ZERO on BITCOIN or CryptoCurrency.

Reason 4 not to trade BITCOIN:

Another point: Let us say someone invested $7000 in BITCOIN and made $14000 in 3 months.

In percentage terms that is 100% return in 3 months but in real-world that’s just $7000 made with too much risk. BITCOIN can go up and down 10% in one day. 🙁 Read this:

Bitcoin is too volatile:

https://www.investopedia.com/articles/investing/052014/why-bitcoins-value-so-volatile.asp

In June 2011 BITCOIN crashed 99%:

https://finance.yahoo.com/news/7-biggest-bitcoin-crashes-history-180038282.html

Here is more – 1 trillion loss of BITCOIN traders in a single day:

https://www.business-standard.com/article/markets/global-crypto-market-suffers-1-trillion-loss-as-bitcoin-crashes-122012200521_1.html

I will never invest in anything that can crash as much as 99% in a day at such a high price.

CONCLUSION:

BITCOIN or any other speculative product is great only if I invest 15000 and make at least a quarter/half a million in 10-15 years – something that can change your life. These only good stocks can do LEGALLY – BITCOIN & Crypto Currency Trading cannot. BITCOIN is rising because people are investing in this shining object like 10k to 15k – this bubble will burst once Govt takes action (Indian government has already started taking action), or people know the reality what I told you – 7k becoming 14k that’s all – and people lose interest because this will NOT happen always – there is a risk of the huge decline.

Greed is the biggest killer of money – BITCOIN And Crypto Currency Trading is one of them.

When you have better options to make monthly income peacefully why should you invest in such a risky trade?

Disclaimer: I do not trade Crypto Currency as I find them to be too risky to trade. The post above is my personal view and may differ from yours. If you do trade Crypto Currency please let me know in the below comment section your experience.

{ 0 comments }

This post was written on: Thursday, November 4, 2021

Diwali Muhurat Trading is a 50-year-old tradition for Equities, Equity F&O, Currency F&O, and Commodities market. Today – Thursday, November 4, 2021, is Diwali 2021. Today the Diwali Muhurat Trading is set to be held between 6:15 PM to 7:15 PM.

From 5:45 PM to 6 PM there will be a Block Deal Session. A Block Deal Session is a single transaction, of a minimum quantity of five lakh shares or a minimum value of Rs 5 crore, between two parties which are mostly institutional players. The transaction happens through a separate trading window.

The Pre-Open Session will be held between 6 PM and 6:08 PM. A pre-open session is held before the actual market opening. It helps to stabilise volatility and unusual movement in the market due to major announcements. NSE pre-open market is the same as BSE. Please note that a pre-open session is held every day if the market will open for trading.

As in Nov 2021, the Indian stock market trading hours start at 9:15 AM and end at 3:30 PM. However, the Indian markets open between 9:00 a.m. and 9:15 a.m. for a pre-open market session. Pre-open market sessions had begun in India in 2010.

What you should do during Diwali Muhurat Trading?

1. Do not trade derivatives as 1 hour is a very small time to decide and take a trade. Plus liquidity will be low.

2. Buy shares for the long term – this you should do in every Diwali. If you need help reply back. Click Here to Open a Low Cost Brokerage Account where Stock Buying & Selling is FREE!!!

3. Make an excel file to write down your trades and to maintain a profit and loss register.

Wishing You & Your Family a Very HAPPY DIWALI 2021!!!

{ 0 comments }

October 21 saw Index touch a record high to 18,604.45. This happened because of these reasons:

1. Decreasing COVID cases in India and no increase in cases even after a lot of festivals in the month.
2. The International Monetary Fund, as well as India’s central bank, this month estimated the nation’s gross domestic product will grow 9.5% in the year ending March 2022. This data is the quickest among major economies. Compare to last year same time the GDP of India contracted 7.3%.
3. Manufacturing sector saw the fastest growth giving signals that the economy is moving in the right direction.

After reaching new highs profit booking was obvious. Due to this, the index reversed from the higher level mainly coming in the private banks, IT, FMCG and Financial services sectors.

A medium-term decline cannot be ruled out for Nifty. However, the fall will not be steep.

If there is profit booking in stocks Nifty will find support at 17,000 levels and then buyers will take charge and may take the Index to 19,000-level.

So medium-term support for Nifty as in November 2021 is 17,000 and resistance is 19,000.

{ 0 comments }

NSE EOD as on Thursday, 07-Oct-2021

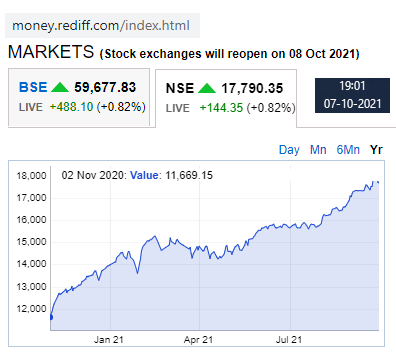
In the last one year, Nifty rallied from 11669 to 17790 as of 07-Oct-21 closing. That’s a growth of almost 52%.

Now ask yourself this question – has your trading account gained 52% in the last one year? Or even 25% (half of it)?

Or has it lost money?

If you lost money then what mistakes you did?

Do you repeat this mistake?

Maybe yes.

But do you want to repeat this mistake again and again? If yes the results will be the same.

Therefore you must learn how to trade correctly with a proper plan. A losing trade loses because there is no proper planning. After doing my courses you will become a disciplined trader.

You will learn when to enter and when to exit. There is no hope strategy.

Moreover, hedging will reduce the stress that you are currently having trading because you will know that loss will be limited and under control.

I can understand that there are many online courses available in the market now so it’s hard for you to take a decision.

All the testimonials you see here are genuine:
https://www.theoptioncourse.com/what-traders-say-about-this-course/

Here is snapshot of my course content:

Course 1: Nifty Conservative Options Course

Strategy 1: Non-directional strategy with 80% success rate – minimum 50k required
Strategy 2: Adjustments to Strategy 1
Strategy 3: Conservative Stock Equity Options Strategy – Equity with options hedging strategy
Strategy 4 & 5: Conservative Future Hedge Buy & Sell Strategy – 1 lakh required

Bonus Strategy for Reversal Benefit of Nifty.

Course 2: Bank Nifty Weekly Options Course

Strategy 1: A very unique way to hedge futures with options – but aggressive strategy. Min 25000 required. Success rate 60%.
Strategy 2: Creating Spreads on Weekly Options. 70% success rate. You will make 1.5-2% A WEEK.

To learn the strategies you will get my support to understand the strategies for one year.

After payment, I will send 6 PDFs where I have explained the strategies like a video with screenshots of Nifty/BN and then the explanation – STEP by STEP of what exactly you need to do. You can ask me questions on WhatsApp, email or phone for one year the doubts on the strategies in LIVE markets.

You can pay the course fee here:
../course-fees/

{ 0 comments }

First what is India VIX Index?

Volatility Index is a measure of market’s expectation of volatility over the near term. Volatility is often described as the “rate and magnitude of changes in prices” and in finance often referred to as risk. Volatility Index is a measure, of the amount by which an underlying Index is expected to fluctuate, in the near term, (calculated as annualised volatility, denoted in percentage e.g. 20%) based on the order book of the underlying index options.

India VIX is a volatility index based on the NIFTY Index Option prices. From the best bid-ask prices of NIFTY Options contracts, a volatility figure (%) is calculated which indicates the expected market volatility over the next 30 calendar days. India VIX uses the computation methodology of CBOE, with suitable amendments to adapt to the NIFTY options order book using cubic splines, etc.

Source:
https://www1.nseindia.com/products/content/equities/indices/india_vix.htm

After a lot of months INDIA VIX has come to a normal level. Normal level of INDIA VIX is considered between 10 and 15. Anything above 15 is considered high.

Look at INDIA VIX on 02-Aug-21 at 7.50 pm:

India VIX 02-Aug-21

And then look at how it remained near 25 for last 1 year which is considered high:

India VIX Aug 20 to Aug 21

Look at Max chart of India VIX – you can clearly see that it remains below 15 most of the times except for Mar-Apr 2020 to June 2021. I think the reason is coronavirus scare.

Max chart India VIX Aug 21

Now that the vaccine is available the stock markets have gone up and the INDIA VIX has gone down.

INDIA VIX an stock markets are inversely proportion to each other. See how in the last one year BSE SENSEX has gone up while INDIA VIX has gone down.

BSE Sensex Aug 20 to Aug 21

More in INDIA VIX

If you do not know, option premiums are heavily dependent on INDIA VIX.

You can see India VIX here:

https://www.moneycontrol.com/indian-indices/india-vix-36.html

Or just Google INDIA VIX.

What happens if INDIA VIX drops?

Volatility in the stock markets will be low but option premium will also be low. So option seller’s return on investment will decrease. To increase the return on investments you can hedge your trades.

To learn hedging and managing option selling you can do my Conservative Options Course and Bank Nifty Weekly Options Course.

You can pay the course fee here.

What happens after payment?

After payment, I will send you the strategies in your email. For any doubts, you can ask me qustions to clear your doubts via call/WhatsApp on 9051143004.

Support will be for one year from the date of payment. You will also start getting paid emails for the strategies to trade.

After payment, I will send 6 PDFs where I have explained the strategies like a video with screenshots of Nifty/BN and then the explanation – STEP by STEP of what exactly you need to do.

You can ask me questions on WhatsApp, email or phone for one year the doubts on the strategies in LIVE markets.

If you are unable to make the strategy I will make it for you to follow-through and learn.

Articles on my site on India VIX:

https://www.theoptioncourse.com/how-india-vix-is-calculated-and-what-to-expect-after-seeing-high-or-low-india-vix/
https://www.theoptioncourse.com/india-vix-over-17-what-it-means/
https://www.theoptioncourse.com/union-budget-2021-india-vix-will-crash/
https://www.theoptioncourse.com/sudden-drop-of-india-vix-means-what/
https://www.theoptioncourse.com/india-vix-surges-26-74-caution/
https://www.theoptioncourse.com/impact-on-nifty-bank-nifty-india-vix-due-to-general-elections-2019/
https://www.theoptioncourse.com/what-is-india-vix-and-why-it-changes/
https://www.theoptioncourse.com/india-vix-increasing-by-22-in-a-single-day-is-not-good/

{ 0 comments }

Owner earnings is different from the company’s earnings. In this post, I will explain what is Owner earnings of a company and teach how to calculate the owner’s earnings. It’s a long post please get a cup of coffee and read full.
 
Owner earnings is a valuation method detailed by Warren Buffet in Berkshire Hathaway’s annual report in 1986. He stated that the value of a company is simply the total of the net cash flows (owner earnings) expected to occur over the life of the business, minus any reinvestment of earnings.

Here is the 1986 annual report:
 
https://www.berkshirehathaway.com/letters/1986.html
 
Let me explain this in simple language with an example.              
 
In India, one business that cannot fail is selling tea/coffee in a good location.
 
Imagine that you want to start a business and find a shop in a good location. You finalize a 10 years lease for renting the property. We assume it is ₹20,000.00 a month (expenditure).
 
You design the interiors of the shop. For this about ₹500,000.00 was spent (expenditure).
 
You now have to spend money to buy a gas stove, utensils, cups and plates, coffee roasters, espresso machines, etc. For this about ₹200,000.00 was spent. Form now we assume that ₹2 lakh will have to be spent every 2 years for repairs and buying new utensils (expenditure).
 
Please note that the money spent on interiors was permanent but the machines and utensils will need regular expenditure like repairs, buying new utensils etc. So rent, repairs, utensils fall under recurring expenditure.
 
Your restaurant now looks good and is ready to take customers.
 
But wait there are more expenditures left. They are coffee beans, tea leaves, milk, sugar, water, napkins, paper cups, etc. For this expenditure is approx. ₹25,000 a month. Please note that this is a recurring expenditure. This can vary between 20 to 30k a month. So I have taken an average of ₹25,000 a month.

Finally, on Apr 01, 2020, you open the restaurant for customers.
 
Nice location, good quality tea/coffee resulted in the huge success of your restaurant.

Fast forward to Mar 31, 2021. One year passed since you opened the restaurant.
 
We assume your revenue collected was ₹24,00,000.00 (24 lakh or 2 lakh a month or ₹6666.66 per day tea/coffee+sandwiches sold per day) in the first year of business. Here is some calculation that this is possible. To get a revenue of ₹6666.66 per day you have to get just 50 customers a day with an average bill of ₹134.00. 134 * 50 = 6700. If your restaurant is open 12 hours a day from 9 am to 9 pm then to get 50 customers all you want is 4 customers on an average per hour. 50/12 = 4.1. With just 4 customers per hour, your revenue collected was ₹24,00,000.00. Calculate yourself revenue collected if 5 customers come per hour. TIP: If you want to start a business this is a great idea.

Now it’s time to calculate the profits to pay taxes.
 
Revenue: ₹24,00,000.00
 
Expenditure first year:

Rent:  20,000 * 12 = ₹240,000.00

Interior Design (including furniture): ₹500,000.00 (This will not be included from the second year of business)
Recurring expenditure for utensils, cups and plates: 8,000 (a month) * 12 = ₹100,000.00 (added 4000 to make it whole figure)
Recurring expenditure to make coffee/tea: 25,000 * 12 = ₹300,000.00

Salary for helper to make coffee and taking care of the business: 25,000 * 12 = ₹300,000.00

Total expenditure:  240000 + 500000 + 100000 + 300000 + 300000 = ₹14,40,000.00 (14 Lakh 40 Thousand)

Profit first year of business: 2400000 – 1440000 = ₹960,000.00 (Nine Lakh Sixty Thousand)
 
Note that from second year of business profit will increase to 960000 + 500000 (interior design one time expenditure) = ₹14,60,000.00 or more/less.
 
Calculating the first-year tax as per Income Tax Slabs & Rates of FY 2020-21:

Your income tax slab is between ₹7,50,001 – ₹ 10,00,000.

This you need to pay:

₹37500 + 15% of total income exceeding ₹7,50,000

960,000 – 750,000 = 210000 * 15% = ₹31,500.00

Final tax: 37500 + 31500 = ₹69,000.00

So the profit after tax in the first year (FY 2020-21) is:

960,000.00 – 69,000.00 = ₹891,000.00 (Approx. ₹74,250 per month)
 
You keep this money in a nearby SBI checking account.
 
Now, this account already had some cash before you opened an account. Assuming it was ₹500,000.00
 
So you will think that after paying taxes on 01-Apr-21, this account will have 891,000 + 500,000 = ₹13,91,000.00? Right?

NO!!!
 
Why? Because a lot of deposits and withdrawals were made during the FY 20-21. Some withdrawals were unexpected but required to run the business.

Deposits made is equal to revenue (all the cash collected from customers): ₹24,00,000.00
 
Withdrawals made are equal to expenditure: ₹14,40,000.00
 
So final balance remaining:
500000 + 2400000 – 1440000 – 69000 – 100000 = ₹12,91,000.00
 
You must be thinking from where in the expenditure 100000 came from?

These are unexpected expenditures that every business has to face. This may include but not limited to repairs that were supposed to be done once in 3 years, coffee bought at a higher price due to non-availability of coffee that was regularly used in the shop, lawyer fee for any legal issue, wear and tear of interiors, wear and tear of furniture, coffee making equipment, etc.
 
This extra expenditure can sometimes be huge and needs to be managed. It’s called depreciation.

Depreciation is unknown, however, CAs allocates the cost of a tangible or physical asset over its useful life or life expectancy. Depreciation represents how much of an asset’s value has been used up. Depreciation comes under expenditure and the company does take the benefit of taxes on them.
 
Note that depreciation is not fixed, it keeps varying from year to year.
 
So what did you learn?

In the first year of business, your net income will be less and subsequently increase over the years.

For example, FlipKart.com started in October 2007 took several years to just breakeven:

https://www.livemint.com/Companies/xRKMBufiZd8XSyn0ZbuZzM/Flipkart-aims-to-break-even-this-year-by-paring-discounts-o.html
 
Overhead expenditures are a major issue for big businesses. Owners cannot even know what kind of unexpected expenditure may occur in future, so big business keeps some percentage of the revenue separately for unexpected expenditures.
 
Here we have taken the example of a simple shop kind of business where not much monitoring is required for overhead expenditures but for big businesses, if not managed well, these unexpected/overhead expenses can lead to the fall of a business.

Here is one big company that failed partly due to this reason and other reasons. Lehman Brothers Collapse:

In 2008, it had $639 billion in assets, technically more than enough to cover its $613 billion in debt. However, the assets were difficult to sell. 5 As a result, Lehman Brothers couldn’t sell them to raise sufficient funds. That cash flow problem is what led to its bankruptcy.
Source: https://www.thebalance.com/lehman-brothers-collapse-causes-impact-4842338
 
So if you too want to start a business you must learn the difference between “net income” and “operating cash flow”. Operating cash flow must include unexpected expenditures. Operating cash flow is the life of a business. Without sufficient operating cash flow, a business will collapse.
 
Now another question:

You started this business to make money to run your family right?

So how much can you withdraw from ₹12,91,000.00 in that year for your own personal expenditures? Please note that you cannot withdraw 100% as this will finish the business. Withdrawing even 90% can hurt the business.

This is what you can withdraw:
 
As a thumb rule, you can withdraw any amount over and above 3-4 months of “operating cash flow” which must include an average of 3 months of normal expenditure.

 
And you must also include inflation in mind. Say for example if in 2020 your 3 months operating cash flow is 100,000.00 then in 2021 it will be 105,000.00.
 
It does not end here. Remember every two years there is expenditure on buying new parts/entire machine to make coffee. Now what you spent in 2020 to get the same machines will cost more, about 10% more.
 
This must be included in the operating cash flow which you cannot withdraw.
 
10% of 3 lakh is 330,000. So you have to keep at least a third of this in the operating cash flow because this expense may come anytime.

Do not forget that you may need 50% of the money that you spent on furniture every 10 years. This is for changing or replacing the damaged furniture.
 
Or you may want to change the entire furniture and replace them with better-looking ones in a few years time especially if your business has grown. This will be a major expense. You must have noticed in one of your favourite restaurants suddenly one day that they have changed all the furniture.
 
This expense maybe 20% more than what you spent for the first time.
 
Since you may need this money in 10 years’ time, you have to calculate and keep this amount too in the operating cash flow. If you will not keep it now then in the 10th year you may find it difficult to manage the cash flow.

Now coming back to your account. It has ₹13,91,000.00.

Note that now when you want to withdraw you have entered the second year of business where you are likely to make ₹14,60,000.00.
 
We assume every month expenditure * 3 months plus other overhead operating cash flow and future expenditures comes to ₹144,000.00. So 144000 * 3 = ₹4,32,000.00

So you can withdraw: 1391000 – 432000 = ₹959,000.00
 
₹959,000.00 is the Owners Earnings
 
What do you conclude from this?
 
That money lying with the bank of the company is not what is “owned” by the owners. What matters for the owner is how much cash they can withdraw from this account for personal use without hurting the business in the short as well in the long term.

Lesson learned:
 
If you plan to buy a stock you must think like an owner. You should see the financials especially the debt of the company. Try to figure out how much the company can give dividends without disturbing their business.
 
And currently what you are paying to get one stock. Does that make sense?
 
Conclusion:
 
Owners earnings is not the net income of the company, not the profit of the company but it’s the total money lying with the company minus debts if any minus money needed to run the company for the next few months i.e “operating cash flow”. For big companies, it has to be the next few years and for small it’s the next few months. For a small shop that you see in your area Owners earning (shopkeeper’s earning) for one month is total revenue made minus expenditures to buy products for the next one month minus bills to be paid like electricity minus three months of cash reserved as a deposit to run the shop.
 
I hope you can understand that finding out the exact owners earnings is not possible but the owner can get an approximate figure based on the above-written points and take out the money to his/her personal account.
 
With that, I end this long article and hope you have understood how to calculate the owner’s earnings.
 
If you want to add/ask something do write in the comments section below.

P.S: I have written a detailed PDF on how to choose stocks for investing. Plus I have named 21 such stocks that you can start investing from today. How you can get it? Click here register and open an account in India’s No1 discount broker ZERODHA – stock buy and sell is FREE. Please inform me once your account is opened.

If you already have an account in ZERODHA, you can click here and open an account in UPSTOX and get the PDF. UPSTOX is also a good discount broker.

What you will learn from this course?

1. 14 stocks to invest in now for the long term until you retire.
2. How to keep booking partial profits in them and reinvest is across the 14 stocks – rotation of profits to take the DOUBLE compounding benefit.
3. 7 more stocks that you can invest in if you are an HNI and want to diversify your portfolio.
4. A simple and logical explanation of why I chose these stocks and how you can also do.
5. How to start investing in these stocks.
6. The Ocean Wave Profit Booking System – an approach no one teaches.
7. What to do with the profits booked – comes under meeting financial goals.

{ 0 comments }

I have written earlier in my blog on managing the personal financial portfolio and asset allocation which I follow personally, you can read it here. But I am no genius, so writing this post to help you understand a very popular stock investment, asset allocation and money management strategy known as “The Kelly Criterion”.

First a word on who is Kelly?

John Kelly was a physicist working with AT&T’s Bell Laboratory. He developed the Kelly Criterion to assist long-distance telephone signal noise issues in AT&T. In 1956, John Kelly published a paper titled A New Interpretation of Information Rate, now available as a book – Bet Smart: The Kelly System for Gambling and Investing. In the paper, he draws an analogy between the outcomes of a gambling game and the transmission of symbols over a communications channel. This is basically an allocation technique also called the Kelly strategy, Kelly formula, or Kelly bet, that we can follow in our investments that you will read in this article. Kelly’s original paper can be found here ( not easy to understand, lots of mathematics there). In the paper, Kelly described a simple and elegant way for investors to strategically allocate capital in the face of uncertainty. This is what is now known as the Kelly Criterion.

There are a lot of writings on how much to diversify money into each stock, how many stocks to invest, for how long etc. This comes under asset diversification and money management. The thumb rule should be – “too much diversification is bad – so stick to a few chosen stocks for the long term”.

Side note: I do have a course on How to Choose Stocks and Invest for Short Term and Long Term profits. You can get the course free if you open a ZERODHA Demat account mapped to me. Click here to register and start the process. Once done I will send the strategy to your email. I have chosen 21 stocks to invest which I will reveal in the course, plus I have also written how to chose stocks yourself for investing. 

In this article, you will learn how the Kelly strategy works and how you can use the formula to help in asset allocation and money management. The Kelly Criterion is a mathematical formula that helps investors and gamblers calculate what percentage of their money they should allocate to each investment or bet.

With time the gamblers too started using The Kelly strategy to maximize their chances to win in horse racing. Today investors, as well as gamblers, use this formula to maximize their profits. They calculate what percentage of their money they should allocate to each investment or bet.

In fact, The Kelly Criterion strategy is used by HNI investors like Berkshire Hathaway‘s Warren Buffett and Charlie Munger, along with legendary bond trader Bill Gross.

Now let me discuss “The Kelly Strategy”. I will have to start with an example to help you understand.

Suppose you are a novice investor, you just opened an account to invest in the share market and ready to invest.

You do not want to risk too much capital to start with. So you search for a good stock, but then you realize that good stocks are costly and so search for a mid or small-cap stock. By chance, you stumble upon a stock priced at 10 (let’s call it ABCD stock) but found that it is a highly volatile stock. It either halves or doubles in value in one month but there is no way to predict the future. Since the amount you want to invest is low you take your chances and invest in that stock. You just buy 100 stocks by paying Rs.1000/-. Not too much risk right?

At the start if each month you can re-balance your portfolio. Re-balancing means you can buy more of the same stock if you have the cash but just a few like 10 stocks or something. By buying 10 stocks your life will not turn to hell. Its a minuscule amount that you can easily invest.

IMP TIP: What is written above is a very important advise. If you want to keep a stock for 10 years and above then make sure to re-balance it every month. Just buy few more do not buy too much in greed. With time you will get the best average price. After 5 years of investing if you need some money and the stock is in good profit you may sell some and take cash out for emergencies.

After a long time. Long time is 10 to 20 years you will need to sell all of the holding of the stock to liquidate and get cash. Nowadays it can be done with the [press of a button.

You will want the stock to give you the max profit.

I have written above that you need to re-balance the stock holding. Now here is where “The Kelly Criterion For Stock Investment And Money Management” comes into place.

Here is your re-balancing strategy:

Imagine this is the first month, means 30 days have passed since you invested. It is time for re-balancing. Since the stock ABCD is highly volatile in 30 days, it can either double or half or may be 10% or more up or down.

Lets assume ABCD stock either doubles or halves in a month. So for each ₹10 invested you get either ₹20 or ₹5 at the end of the month. Note that in real world this may not be possible, but the logic is good for a highly volatile stock.

Here is the average of what you will get at the end of the month: (₹20(double) + ₹5(half))/2 = ₹12.50.

Lets calculate the return:

(2.50/10) * 100 = 25%

That’s an average of 25% monthly return on whatever money you invest in ABCD stock.

This looks great right? So the best approach is to invest whatever you can at the start of the 10-20 years of investment right? No as the stock WILL not double every month. Well this is also not a bad investment idea especially you can find out a fundamentally strong company that will remain fundamentally strong over the next 20 years. Read this article to know how an investment of ₹10,000 became over 800 crores in 30 years.

Assuming someone actually does that in the ABCD stock we are discussing. I mean invest once for 20 years. Lets see the return after 20 years.

Best case: ABCD stock doubles every month. Impossible scenario yet for calculation part the result will be thousand of crores.

Worst case: ABCD stock gets halved every month. Return is less than 1 paisa.

As you can understand, neither the best case nor the worst case are remotely likely. The outcome will be something in between.

IMP TIP: Read the above scenarios again. You either make good money investing or lose it all. Therefore you must invest the money that you can afford to lose in stock markets. This can be 5% of your take home salary. Of course worst case scenario will happen only if you take unnecessary risks like greedy trades. However if you become a conservative trader you will make upwards of 2% a month. This is a great return. My conservative option course will help you learn less risky option strategies.

Coming back to our topic The Kelly Criterion Strategy we have to do some analysis on the outcome.

Here is assuming the outcome of 10-20 years of investment – please note that dividends, bonus shares all are included:

Almost all money wiped out = 35%
10% yearly return = 50%
15% yearly return = 10%
20% yearly return = 3%
21% or more yearly return = 2%

I hope you can guess now, if you invest in 10 such stocks very small amount every month only 3 will wipe out all money nor just give you back what you invested, but 4-5 will give 10% and 2-3 will give stellar returns of more than 15% a year.

All in all you will be in good profit.

Now here is some mathematics.

Assuming Mr. Ashok chooses 10 stocks to invest every month of ₹10 each. He invests ₹1000 in each stock that’s an investment of ₹10k a month. Very much possible in today’s world. If any stock price reaches ₹1000 he will buy just 1 share a month so that he never invests more than ₹10k a month.

Total investment made in 20 years: 10000 * 12 * 20 years = ₹24,00,000.00 (Twenty Four Lakh)

In each stock he invested = 1000 * 12 * 20 = ₹2,40,000.00 (Two Lakh Forty Thousand)

Now the math of the returns:

In 3 stocks he lost 50% of his investment: (2,40,000/2) * 3 = ₹3,60,000.00 (Three Lakh Sixty Thousand Loss)

In 4 stocks he made an average of 10% yearly return.
Final value = 7,59,368.84. Profit = 7,59,368.84 – 2,40,000 = ₹5,19,368.84
Total profit in 4 stocks = 5,19,368.84 * 4 = ₹20,77,475.36 (Twenty Lakh 77,475.36)
(Calculated from this website)

In 3 stocks he made an average of 18% yearly return.
Final value = 1,900,361.23. Profit = 1,900,361.23 – 2,40,000 = ₹16,60,361.23
Total profit in 3 stocks = 16,60,361.23 * 3 = ₹49,81,083.69 (₹ Forty Nine Lakh 39,946.92)

Now lets calculate the FINAL PROFIT:
49,81,083.69 + 20,77,475.36 – 3,60,000.00 = ₹66,98,559.05 (₹ Sixty Six Lakh 98,559.05)

What did you notice?

Even if 50% of the stocks outperform they will skew the average and beat the losses made form the other dud stocks by far over the long term. Note that loses are limited to the amount invested but profits are unlimited. That’s the genius of Kelly – he found that strategy.

So the final question – How to find 10 stocks that may give stellar returns over the long term?

I can help you or at least give you an idea of how to find.

All you have to do is click here and register – the most trusted, honest and No.1 Discount Broker in India. They do not charge any brokerage to buy and sell stocks. However I may get a percentage of the brokerage that is generated by you if you open an account mapped to me.

Contact me after your account is opened I will teach you how to find good stocks to invest for the long term.

Hope this article has helped you to learn something about stock investing. If you have any doubts please ask in the comments section below.

{ 0 comments }
Menu