
Sponsored Ad: Click Here to Open a Share Trading Account Online for FREE and Pay ZERO Brokerage to Buy and Sell Shares!!!
Since I started this website in 2014, the most asked question was related to the Nifty Option Chain NSE (National Stock Exchange). A lot of traders see the options chain before taking a trade. In this post, you will learn how to read, understand and interpret the option chain. I will explain the option chain of NSE available here:
https://www.nseindia.com/option-chain
In short, an option chain will show the LTP (Last Traded Price) of the options of a particular expiry of a stock/index. You can change the expiry date or the stock to see the options chain of that stock’s expiry.
There is a myth that the option chain indicates which option to buy. Please note that option chain does not give any indication of where the market is heading.
The Nifty Option Chain NSE is an indicator that shows the current price movement of the stock market. It is based on options trading and is used by traders to predict future movements of the stock market. Note that it’s used to predict the movement – it does not guarantee the move up or down.
In this post, I will discuss what exactly a trader sees in the Nifty Option Chain and decides the direction and which strikes to trade, whether to buy or sell call or put etc.
How to Trade Options with the help of the Nifty Option Chain?
Details of the Nifty Option Chain NSE
The nifty Option Chain is one of the most popular indicators among investors as well as traders. This indicator helps them to determine whether the Nifty will rise or fall. However, no indicator gives a guaranteed direction of the markets. Similarly, Nifty Option Chain also gives an indication of where the market is heading or may finish on the expiry day, however, it’s just an indication and not an assurance. Please keep this in mind while reading this post.
What Is an Options Chain?
An option chain also known as an options matrix, is a live listing of all available options contracts and their trading data for a given security. It shows all listed puts, calls, their expiration, strike prices, volume, LTP (Last Trading Price) and more information for a particular stock/index. It is available 24/7 online. When the market closed the last data is kept for traders to study. When the markets open to trade again, the data keeps changing with the move in the stocks.
An option chain has two sections: calls and puts. A call option gives the right to buy a stock while a put gives the right to sell a stock. The price of an options contract is called the premium, which is the upfront fee that an investor pays for purchasing the option. This premium is decided on various factors which you can read here.
How The Call and Put Buyers Profit?
If the price goes above the strike price, then the call buyer will profit. If the opposite happens then the loss will equal the premium paid to buy the call.
If the price goes below the strike price, then the put buyer will profit. If the opposite happens then the loss will equal the premium paid to buy the put.
Similarly,
If the price goes above the strike price, then the put seller will profit. If the opposite happens then the loss will equal the premium received to sell the put minus the premium where the trader decides to take a stop loss.
If the price goes below the strike price, then the call seller will profit. If the opposite happens then the loss will equal the premium received to sell the call minus the premium where the trader decides to take a stop loss.
Important note: Traders look at the option chain mainly to decide which option strike to buy or sell. They mostly buy/sell the strike where they see the most volume (explained below) thinking that most traders (especially HNIs who have access to better insights into the markets) are putting their bets there – so they try to copy the HNIs.
Please note that copying the HNIs does not guarantee success.
Explanation of the Data of the Nifty Option Chain (NSE)
In India, Nifty Option Chain is the most seen option chain therefore I will explain the data shown by the exchange here. You can see the Nifty Option Chain here:
https://www.nseindia.com/option-chain
Please open the above webpage in a different window (by default it will open in a different window if you click), see it then come back here.
You can see:
CALLS, PUTS, OI, Chng in OI, Volume, IV, LTP, Chng, Bid Qty, Bid, Ask, Ask Qty & Strike
Note that this is what I see as of Nov 2022. The data may change with time, however, these are important data and they will be there – some additions may happen in future.
Here is the screenshot:
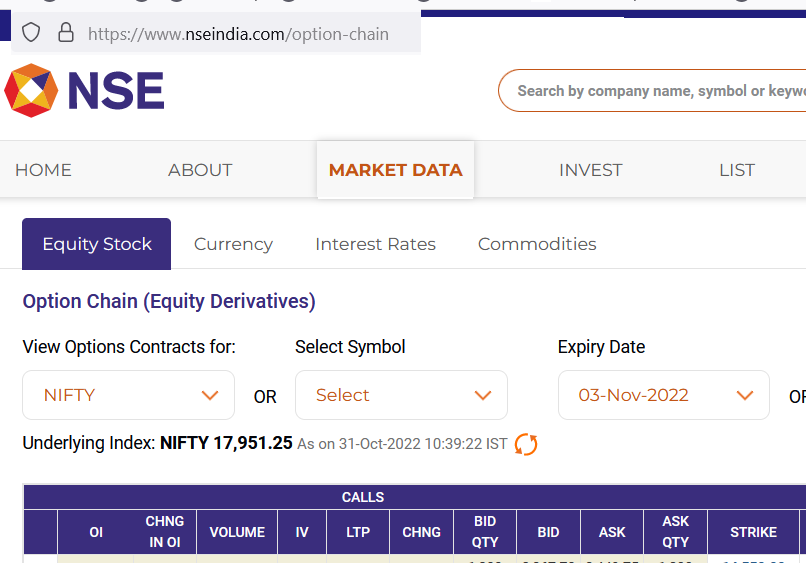
Option Chain Equity Derivatives NSE
Then we can see the open interest, volume, LTP, and strike price of both call and put options which are important parameters to depict the option chain.
Option chain data is the complete picture about option strikes of a particular stock or index in a single frame. If it’s not refreshing automatically you can refresh the page to see the current data. In the Option chain frame, the strike price is at the Centre and all data pertaining to calls and puts on the same strike are presented next to each other. This is made for the clarity of the viewer. You can compare the data of the call and put of the same strike to get an idea of volume and other data of both.
OI – Open Interest:
This is the total number of trades that took place in that option but were not closed. Suppose A bought an option from B at whatever price then the OI will be counted as 1. Suppose the same option is then bought by 10 more traders then the Open Interest will be 1+10 = 11. But now suppose A sees that he is making some profit and decided to sell the option. X bought that option. So the first trade that was opened by A and B is now closed. Therefore the OI will reduce by 1. It will be 11-1 = 10.
Since in the liquid option strikes the trades happen very fast you will see open interest in thousands or even lakhs. If you refresh the page after some time you will see that the OI (open interest) changes.
In technical language, the total number of all outstanding unsettled derivative contracts of an option strike is called the Open Interest.
Open interest can be seen in Nifty Futures as well. You can see it here:
https://www.nseindia.com/market-data/equity-derivatives-watch?name=NIFTY
Is a high open interest good?
If you are an HNI (High Net Worth) trader you may look for options that have high open interest because you will want to enter and exit that trade with ease. If there is low liquidity both entry and exit will be a problem. So yes, high open interest for a particular contract is good if you want to trade with 20 or more lots.
TIP: It is very important to check open interest if you want to trade in a high number of lots otherwise you may face slippage (irrational pricing) while buying and selling the contracts. Slippage in pricing happens when there is less number of people trading. If you hit market orders you may pay a high premium while buying and get less premium while selling. Therefore if you are trading in multiple lots always trade in high open-interest contracts and always place a Limit Order.
Change in Open interest:
As said earlier open interest keeps changing with new trades opening and closing. It becomes almost zero on the last minute of the expiry day. If you see that open interest in the call options is increasing, it indicates that most traders are assuming that the market will move up and therefore money is flowing on the call side. Please note that this is just an assumption markets are unpredictable therefore you should always trade with a hedge or strict stop loss. High open interest on the call or the put side can give you an idea of the direction. It definitely increases the chances of success but does not guarantee it.
If the open interest is declining it indicates that money is moving out and the current trend may start reversing.
Volume:
Volume is another important indicator of the market. Experienced traders look at these two metrics before taking a trade. Volume is the total number of contracts traded in a given period, mostly that day. A high and increasing volume means money is flowing in that contract and the trend may continue for that day. A decreasing volume means the trend is reversing.
Volume is a good indicator for intraday or short-term trading. However, you must have a plan before entering a trade. You must be sure when you will lock in the profits and when you will exit with a stop loss.
Sometimes you will see that the volume is higher than the open interest which suggests that there was a lot of action on that option contract. It usually happens in At The Money (ATM) contracts on an event day such as results or some news on that stock.
Open interest also gives you key information regarding the liquidity of an option. If there is no open interest in an option, there is no secondary market for that option. Derivatives are traded in the secondary market. Shares are issued in the Primary Market (for example IPO), while they are traded in the secondary market.
IV – Implied Volatility:
IV is the market’s forecast decided by some formula based on the trading patterns at that time. It implies the likely future volatility of the stock/market. A high IV means that the stock/index is witnessing and may witness in the short term high volatility. During high IV the stock moves up and down in a rapid way plus the distance between the high and low for that day will be high. During a low IV period markets are calm.
Please note that IV has nothing to do with volume but usually when IV increases the volume also increases. India VIX is the IV index of NSE. You can see it here:
https://www.moneycontrol.com/indian-indices/india-vix-36.html
India VIX is inversely proportional to the movement of the Nifty. You can also read how to trade intraday with help from India VIX. High IV results in a higher premium of options and lower results in a lower premium of options. Some traders buy or sell options looking at IV. They sell when IV is high and buy when IV is low.
What is a good IV for stock options to buy and sell?
Generally speaking, short options/volatility trades become relatively more attractive when the IV rank is above 50%, whereas long options/volatility trades become relatively more attractive when the IV rank is below 50%.
You can find IV of stock options here:
https://www.nseindia.com/option-chain
A high IV in stock options means that the price of the stock will go through a significant change in the next few days. Similarly, a low IV signifies the stock will not move much over the next few days.
LTP- in Share Market
LTP means the Last Trading Price. This means the most recent price on which a trade took place. Every stock, option, future or commodity will have the LTP shown in your trading dashboard. Once your trade goes through then you will see LTP as the rate at which you had done the trade. Another trade and it will change.
Is LTP important?
Today many trading websites offer tables that show you the history of the prices at which the stock was traded most recently – the history of LTP. You can check the history of LTP and buy/short the stock for the short term. If the LTP is increasing over time you can buy and if it’s decreasing over time you can short.
Chng:
This means change. Change is the difference between the current value and the previous day’s market close. Please note that any data change does not mean a recent change – like the price change or VIX change recently. It’s the closing price of the previous day vs the current live price in the market.
Bid Qty:
You see in any market there is a bargain. Every day we bargain for the price we are willing to pay for a product/service with the merchant/vendor. The stock market is not an exception.
Bid – The term “bid” refers to the highest price a buyer will pay to buy a specified number of shares of a stock at any given time.
Bid Qty means the bid quantity – it means the price a buyer is ready to pay for any stock or option or commodity. When you open your trading dashboard to trade you can see the Bid and Ask price for any stock or derivative.
The total bid quantity means the total number of buyers in that particular stock or commodity.
Ask Qty:
It’s Ask quantity. It means the price at which the seller is ready to sell any stock or derivative or commodity.
The term “ask” refers to the lowest price at which a seller will sell the stock. The bid price will almost always be lower than the ask or “offer,” price.
An Explanation of Ask Qty in stocks:
As explained above the Ask price is the price a seller is willing to sell. However for any trade, there can be many sellers, so the stock market software shows the lowest price at that time a seller is willing to sell. The rest are not shown as no one will willingly pay more for trade. Once that trade goes through, the LTP changes and the Ask price moves to the next seller who is offering the lowest price to sell.
Note that once a trade is over the stock makes a move. Now depending on the Demand and Supply the stock can move up or down. If it moves up the sellers will move their prices up, thus the next lower price that is displayed may be higher than the previous Ask price or lower depending on the stock move.
The difference between the bid and ask prices is called the spread. If the spread is high it means that the stock is illiquid. If you are getting into an illiquid trade make sure to trade in the Limit Price, or else you will get a very high rate if you want to buy or a low rate if you want to sell. Limit Price ensures you get the price you are willing to pay or get.
How to buy stock lower than the Ask price?
This is possible only in liquid stocks. Open your trading terminal and set a Limit Price to buy the stock. Note that you can’t set any price to buy the stock. This can lead to a false fall in the stock. For example, if a stock is at 100 and your bid to buy that stock for 90 for a huge quantity then a flash crash may happen in that stock. To overcome this SEBI has prescribed a percentage limit on which traders can ask or bid the prices. This ensures the stock price does not become too volatile.
If the stock falls you may be able to buy at the Limit Price you had bid for the stock. This way you can buy the stock lower than the current ask price.
Strike:
This term is mainly used when trading options. Suppose a stock has many options. Assuming the price of XYZ stock is 50. It may have options at strikes 50, 55, 60, 65, 45, 40, 35 etc. The strike price can be either In the Money (ITM), Out of the Money (OTM) or At The Money (ATM). The strike price determines the premium of that strike.
The strike is also the price at which the underlying security can be either bought or sold once exercised.
Click to Share this website with your friends on WhatsApp
COPYRIGHT INFRINGEMENT: Any act of copying, reproducing or distributing any content in the site or newsletters, whether wholly or in part, for any purpose without my permission is strictly prohibited and shall be deemed to be copyright infringement.
INCOME DISCLAIMER: Any references in this site of income made by the traders are given to me by them either through Email or WhatsApp as a Thank You message. However, every trade depends on the trader and his level of risk-taking capability, knowledge and experience. Moreover, stock market investments and trading are subject to market risks. Therefore there is no guarantee that everyone will achieve the same or similar results. My aim is to make you a better & disciplined trader with the stock trading and investing education and strategies you get from this website.
DISCLAIMER: I am NOT an Investment Adviser (IA). I do not give tips or advisory services by SMS, Email, WhatsApp or any other forms of social media. I strictly adhere to the laws of my country. I only offer education for free on finance, risk management & investments in stock markets through the articles on this website. You must consult an authorized Investment Adviser (IA) or do thorough research before investing in any stock or derivative using any strategy given on this website. I am not responsible for any investment decision you take after reading an article on this website. Click here to read the disclaimer in full.
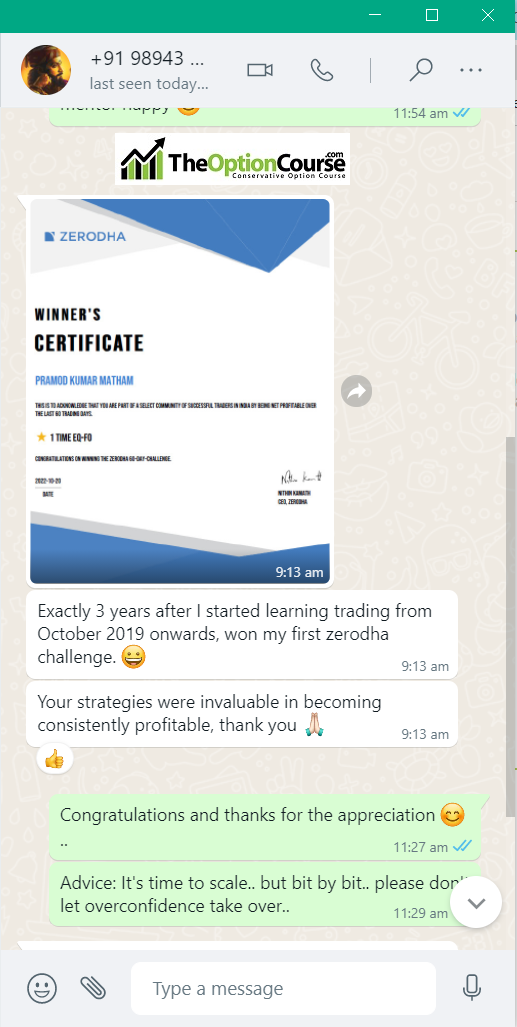
My student gets the Winner's Certificate of Zerodha 60-day Challenge - Click here and Open Stock Buy and Sell Free Account with Them Today!!!
 Testimonial by a Technical Analyst an Expert Trader - Results may vary for users
 60% Profit Using Just Strategy 1 In A Financial Year – Results may vary for users

 Testimonial by Housewife Trader - Results may vary for users