Sponsored Ad: Click Here to Open a Share Trading Account Online for FREE and Pay ZERO Brokerage to Buy and Sell Shares!!!
This article was published on Thurs, 01-Sep-2022
Traders do a lot of speculative trading in the US as well as here in India. 70% of these trades in either options or futures are intraday. I asked a few of my customers why they trade only intraday – most of them replied the same. We do not want to take the overnight risk with our money. They were afraid of gap up or down opening the next day.
Well, there is nothing wrong with being afraid of the gap opening the next day, but most traders do not know that if they hedge their trades, the gap opening will not damage the position. The hedged trade works like a sword to protect the losses from the actual trade.
Trading intraday is ok as long as your position sizing is as per your risk appetite. If you made some money in one Intraday trade, that does not make you a genius of intraday trading. This is called beginners luck. You should not double your lot size in the next trade. There is a very high chance that you will end up losing all of what you won in the last trade. This practice is followed widely by intraday traders.
If you are trading intraday you must guess the direction of the stock indices. Today there is numerous software to give you millions of data in milliseconds. But I have seen that most of them are confusing. Data is just what is happening at this moment not what may happen in future. Intraday traders study something online, or read in some book or do some course and try to read data and take action based on this data.
Technical analysis combined with a good strategy may work intraday but just technical analysis alone is not sufficient. But there is a problem and that is which technical analysis is good?
Here is a List of Names and Descriptions of Some Popular Technical Analysis Indicators:
-
- Bollinger Bands – A Bollinger Band® is a technical analysis tool defined by a set of lines plotted two standard deviations (positively and negatively) away from a simple moving average (SMA) of the security’s price, but can be adjusted to user preferences. For more information visit: https://www.investopedia.com/terms/b/bollingerbands.asp
- Fibonacci Sequence – The Fibonacci sequence is a set of steadily increasing numbers where each number is equal to the sum of the preceding two numbers. Fibonacci retracements are the most common form of technical analysis based on the Fibonacci sequence. During a trend, Fibonacci retracements can be used to determine how deep a pullback may be. For more information, you can visit: https://www.investopedia.com/terms/f/fibonaccilines.asp
- Stochastic Oscillator – This technical analysis is used for identifying overbought and oversold levels. An overbought level is indicated when the stochastic reading is above 80. Readings below 20 indicate oversold conditions in the market. More information here:
https://corporatefinanceinstitute.com/resources/knowledge/trading-investing/stochastic-oscillator/ - Moving Average Convergence Divergence (MACD) – Moving average convergence divergence (MACD) is a trend-following momentum indicator that shows the relationship between two moving averages of a security’s price. The MACD is calculated by subtracting the 26-period exponential moving average (EMA) from the 12-period EMA. For more information read this: https://www.investopedia.com/terms/m/macd.asp
Note: Moving average is a technical indicator that I have personally experienced and seen it works 60-70% of the time. However, it only works for the short term, not the long term. Short term means 15-30 days. MACD will not help in Intraday trading. However, for swing traders and investors MACD is a good technical indicator tool.
- Relative Strength Index (RSI) – This is a very popular technical indicator developed by J. Welles Wilder Jr. The RSI can point to overbought and oversold securities. It can also indicate securities that may be primed for a trend reversal or corrective pullback in price. It can signal when to buy and sell. Oversold securities can be bought and overbought securities can be sold.
An RSI reading of 70 or above indicates an overbought situation. A reading of 30 or below indicates an oversold condition. A chart of closing prices is made for the last few days (mostly 14) and it is compared to historical closing prices to determine the strength or weakness of a stock or index. RSI also measures the speed and magnitude of a security’s recent price changes to evaluate overvalued or undervalued conditions in the price of that security. The RSI is most typically used on a 14-day timeframe.
For more information visit: https://en.wikipedia.org/wiki/Relative_strength_index, and https://www.investopedia.com/terms/r/rsi.asp
Note: Relative Strength Index (RSI) is another technical indicator I have experimented with a few times and seen that it works 70% of the time. Disclaimer: When I use technical indicators I used them in investing only, not for trading derivatives.
- On-balance Volume Indicator (OBV) – On Balance Volume (OBV) measures buying and selling pressure as a cumulative indicator that adds volume on up days and subtracts volume on down days. When the security closes higher than the previous close, all of the day’s volume is considered up-volume. For more information visit: https://www.fidelity.com/learning-center/trading-investing/technical-analysis/technical-indicator-guide/obv
- Accumulation/Distribution Line (A/D Line) – The accumulation/distribution (A/D) line gauges the supply and demand of an asset or security by looking at where the price closed within the period’s range and then multiplying that by volume. The A/D indicator is cumulative, meaning one period’s value is added or subtracted from the last. For more information visit: https://www.investopedia.com/terms/a/accumulationdistribution.asp
- Average Directional Index (ADX) – The average directional index (ADX) is a technical analysis indicator used by some traders to determine the strength of a trend. The trend can be either up or down, and this is shown by two accompanying indicators, the negative directional indicator (-DI) and the positive directional indicator (+DI). For more information visit: https://www.investopedia.com/terms/a/adx.asp
- The Aroon indicator – The Aroon indicator is a technical indicator that is used to identify trend changes in the price of an asset, as well as the strength of that trend. In essence, the indicator measures the time between highs and the time between lows over some time. For more information visit: https://www.investopedia.com/terms/a/aroon.asp
- Stochastic Oscillator – A stochastic oscillator is a momentum indicator comparing a particular closing price of a security to a range of its prices over a certain period. This is somewhat similar to RSI. For more information visit: https://www.investopedia.com/terms/s/stochasticoscillator.asp
- Head and Shoulders Technical Analysis – It is a specific chart formation that predicts a bullish-to-bearish trend reversal. The head and shoulders pattern forms when a stock’s price rises to a peak and then declines back to the base of the prior up-move. Then, the price rises above the previous peak to form the “head” and then declines back to the original base. A head and shoulders pattern—considered one of the most reliable trend reversal patterns—is a chart formation that predicts a bullish-to-bearish trend reversal. For more information visit: https://www.investopedia.com/terms/h/head-shoulders.asp
As you can see it’s very hard to master every technical indicator given above. There may be more, but I only know the above. If you already know some indicators and it’s doing its job – great. Please do let me know in the comments section below. But if you do not know any technical indicator then it’s okay. In this article, I will reveal what is the best way to find the direction of the stock without doing any technical analysis. Just like technical indicators, this will not work 100% of the time. It will work 60-70% of the time, but this method is easier than learning a technical indicator.
Here is a screenshot of Stock exchanges in the United States: Dow Jones Industrial Average (DJIA), Nasdaq Stock Exchange & Standard and Poor’s 500 (S&P 500) INDEX on the closing day of 31-Aug-2022:
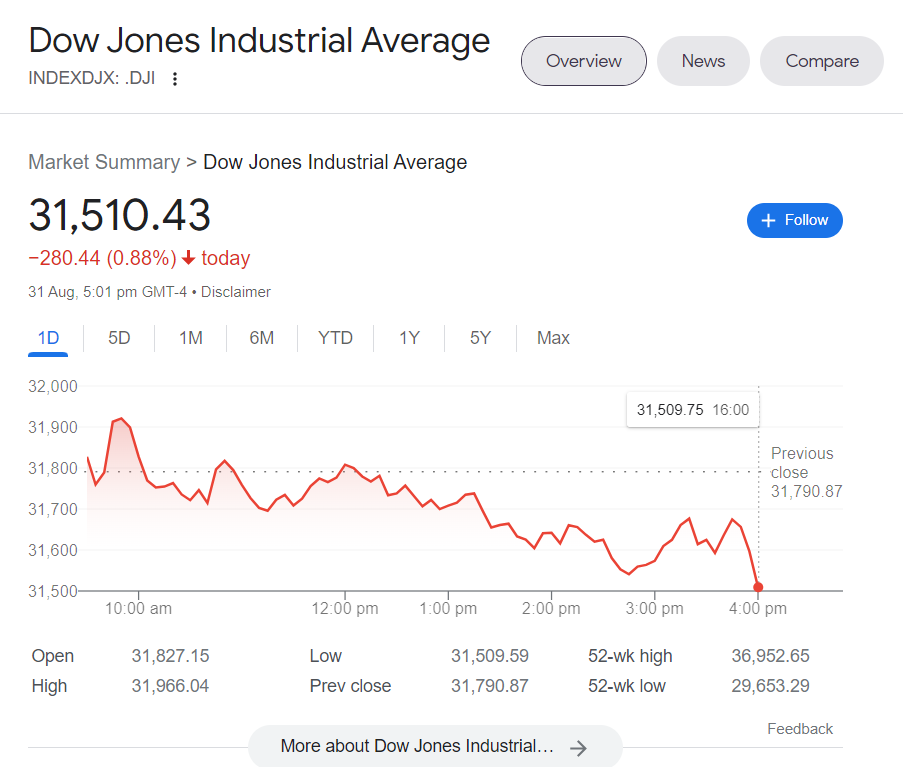
Dow-Jones-31-Aug-22
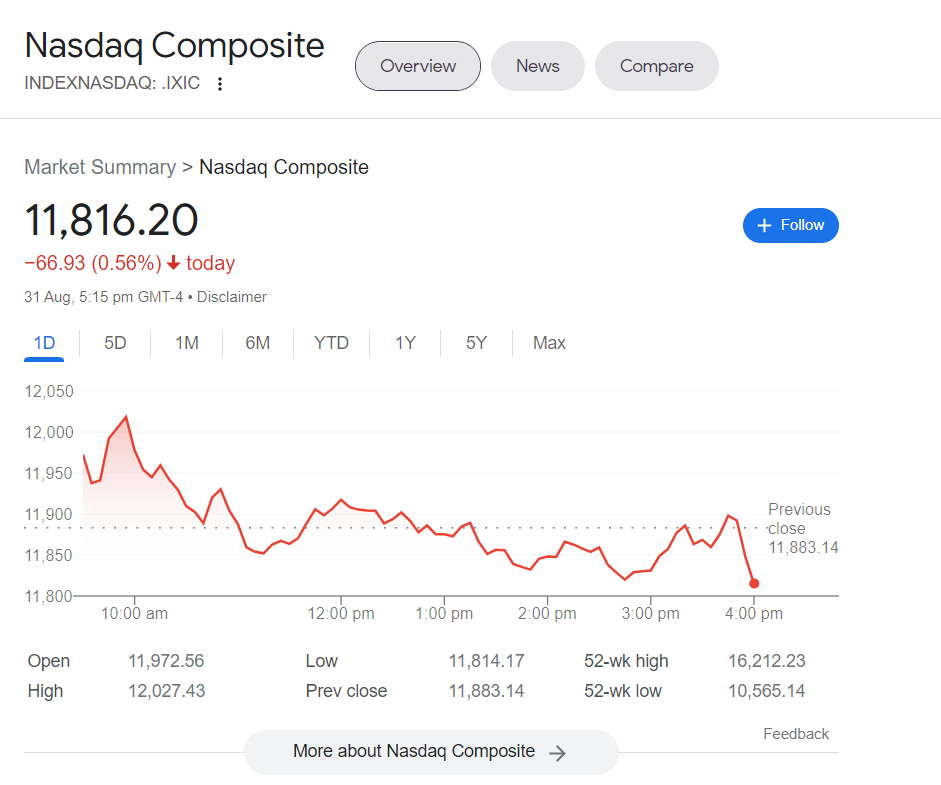
NASDAQ 31-Aug-22
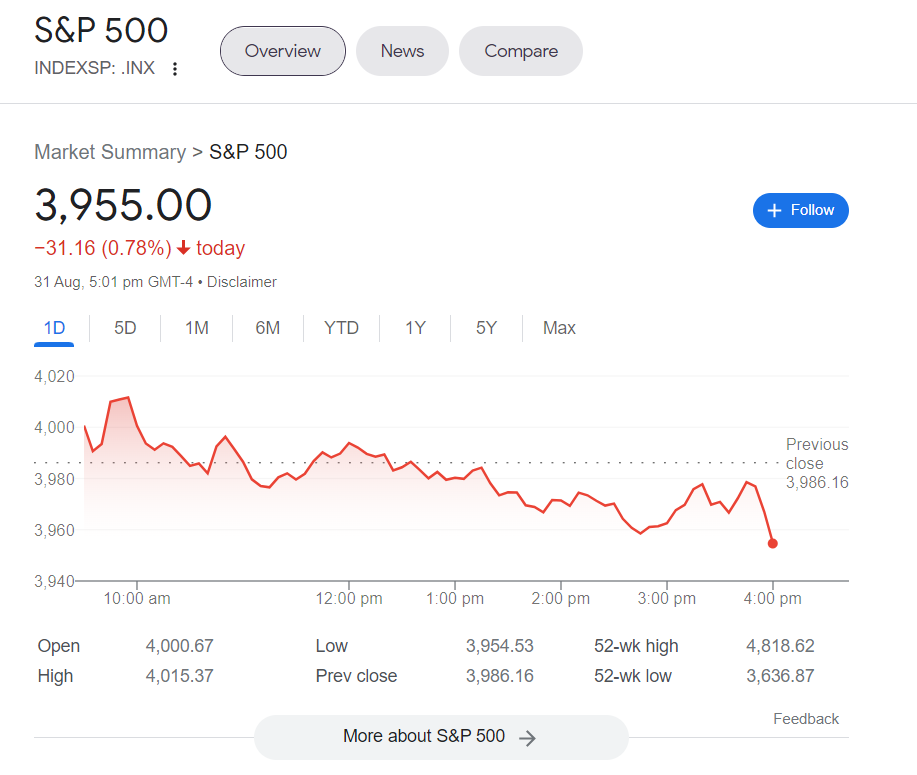
S&P 500 31-Aug-22
And now look at the screenshot of Sensex (on 01-Sep-22, when it was open for trading). Sensex is an index of 30 well-established and financially sound companies listed on the Bombay Stock Exchange (BSE) in India:
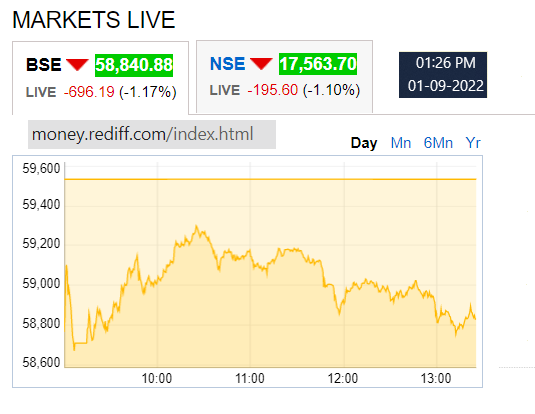
Sensex 01-Sep-22
What do you make out? Can you see the similarities in the movement of the US stock exchanges and India? Due to the time difference, US stock exchanges close much before Indian stock exchanges opened to trade the next day. Of course, if it’s the 2nd day of the month in India, you can see the closing chart of the previous day (1st of the month) of the US stock exchanges and guess the direction intraday of the Index you want to trade on that day. Of course, you will trade Nifty options or futures.
I have seen that Indian markets follow US markets a lot the next day. This will help you to take the trading decision for that day.
Hope this article will help you to guess the market direction intraday and trade well.
Want to know more on how to guess the direction of the Nifty intraday? Read this article.
For any questions on stock trading, you can contact me here or write them down below in the comments section.

Click to Share this website with your friends on WhatsApp
COPYRIGHT INFRINGEMENT: Any act of copying, reproducing or distributing any content in the site or newsletters, whether wholly or in part, for any purpose without my permission is strictly prohibited and shall be deemed to be copyright infringement.
INCOME DISCLAIMER: Any references in this site of income made by the traders are given to me by them either through Email or WhatsApp as a Thank You message. However, every trade depends on the trader and his level of risk-taking capability, knowledge and experience. Moreover, stock market investments and trading are subject to market risks. Therefore there is no guarantee that everyone will achieve the same or similar results. My aim is to make you a better & disciplined trader with the stock trading and investing education and strategies you get from this website.
DISCLAIMER: I am NOT an Investment Adviser (IA). I do not give tips or advisory services by SMS, Email, WhatsApp or any other forms of social media. I strictly adhere to the laws of my country. I only offer education for free on finance, risk management & investments in stock markets through the articles on this website. You must consult an authorized Investment Adviser (IA) or do thorough research before investing in any stock or derivative using any strategy given on this website. I am not responsible for any investment decision you take after reading an article on this website. Click here to read the disclaimer in full.

My student gets the Winner's Certificate of Zerodha 60-day Challenge - Click here and Open Stock Buy and Sell Free Account with Them Today!!!

 Testimonial by a Technical Analyst an Expert Trader - Results may vary for users
 60% Profit Using Just Strategy 1 In A Financial Year – Results may vary for users

 Testimonial by Housewife Trader - Results may vary for users
Comments on this entry are closed.
Thanks for the valuable information