
Sponsored Ad: Click Here to Open a Share Trading Account Online for FREE and Pay ZERO Brokerage to Buy and Sell Shares!!!
Learn how to calculate Annualized Volatility and know if it is worth to know about it.
A lot of traders who have done my options trading course, want to know how to calculate Annualized Volatility.
Volatility is very important factor in option trading. This is the reason many traders want to calculate Annualized Volatility, basically to try to figure out future prediction of Volatility.
Please understand that Volatility is different than Volatility Index. Volatility is the percentage of movement of a stock or Index, Volatility Index is the stock market’s expectation of 30-day volatility. Volatility Index is a complex formulae and is constructed using the implied volatilities of a wide range of options available to be traded in that Index. For example Nifty Volatility Index is based on INDIA VIX which can be found here:
https://www.nseindia.com/live_market/dynaContent/live_watch/vix_home_page.htm
Annualized Volatility is partly Technical Analysis. Basically before traders want to take a trade they would like to know if the stock will move and in what direction. If right they make money, if wrong they exit with a stop loss.
Historically Stocks are more volatile than Stock Index. The reason is stocks are individual entity but Index is a group of stocks. However Annualized Volatility can be calculated on both Stocks and Index.
What Is Volatility?
Volatility is the measure of variation of a stocks movement over time. Over time is not specific but general depending on what is the traders view and what trade he is taking.
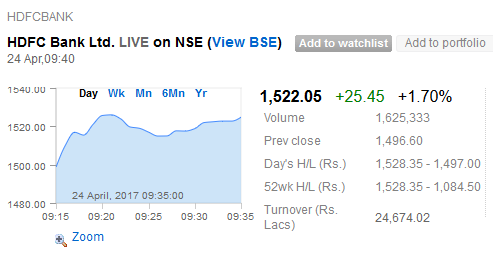
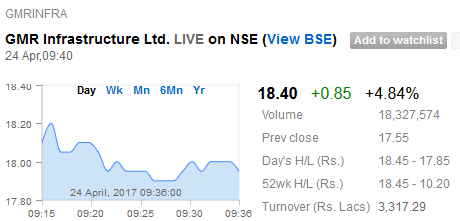
Some stocks are too volatile intraday, but some stocks are not so volatile. For example stocks like HDFC Bank Ltd, are not so volatile intraday, but stocks of smaller companies are very volatile intraday, like GMR Infrastructure Ltd.
HDFC Bank move on 24-April-2017 at 9.40 am – markets are open for trading:
GMR Infrastructure move on the same day, 24- April -2017 at 9.40 am – markets are open for trading:
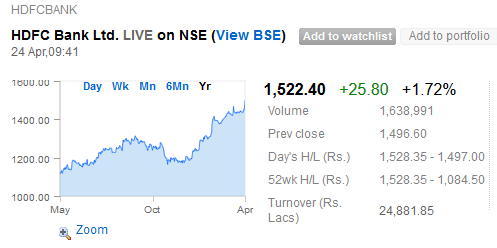
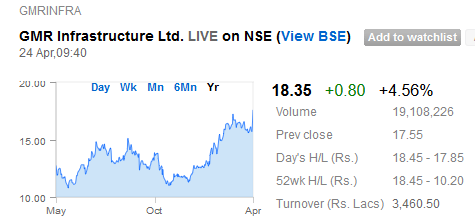
Similarly it is has been observed that some stocks are too volatile over one year time, but some stocks are not so volatile over one year time. For example stocks like HDFC Bank Ltd, are not so volatile over one year, but stocks of smaller companies are very volatile over one year, like GMR Infrastructure Ltd.
HDFC Bank, one year move from May 2016 to April 2017 at 9.41 am – markets are open for trading:
GMR Infrastructure, one year move from May 2016 to April 2017 at 9.40 am – markets are open for trading:
This data is very important to know Annualized Volatility and take a trade based on it.
How To Calculate Stock Volatility
For this we will need historical closing prices of the stock or Index.
Here you will get historical closing price of NIFTY 50:
https://www.nseindia.com/products/content/equities/indices/historical_index_data.htm
You can select the time period and get the closing.
Here is the Historical Data for NIFTY 50 from 01-04-2017 to 24-04-2017:
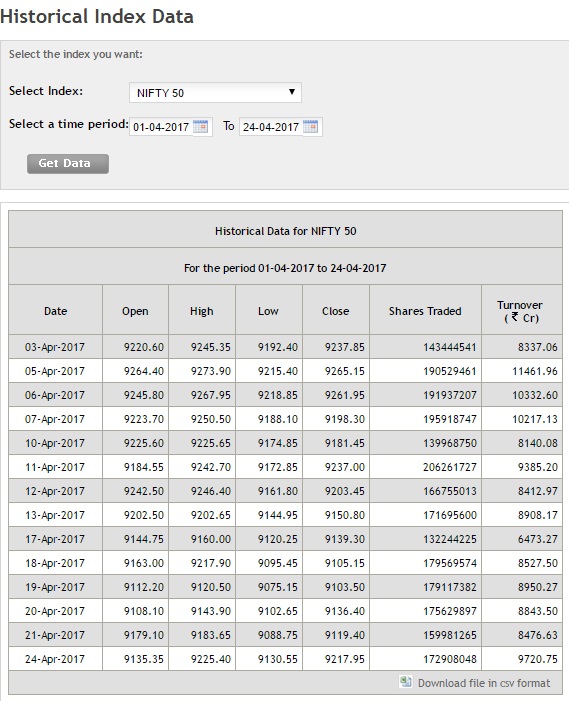
Historical Data for NIFTY 50 from 01-04-2017 to 24-04-2017
You will get these data there:
Date, Opened at, Highest Price for the Day, Lowest Price for the Day, Closed at (this will be required for calculating Annualized Volatility), Total number of Shares Traded, and Turnover in Rs. Crores.
To calculate Annualized Volatility we need the closing price for the day only.
Here is closing price of Nifty from 01-Apr-2017 to 24- Apr-2017. Note that the percentage change in closing price is calculated like this:
Daily % Change = (Current Closing Price – Yesterday’s Closing Price) = XX.XX
XX.XX / 100 = Daily % Change
In other words, subtract yesterday’s closing price from today’s closing price and then divide the result by 100.
Anyone good in making Excel sheets will be able to make them at home. In an Excel sheets the calculations will be automatically done once the formulae to calculate the percentage change is copy pasted in all columns.
Please note that to calculate Annualized Volatility I have taken out the closing price of 03-Apr-2017 because we need the previous day closing price. We have not taken out that price as somewhere it has to start and end.
[table id=2 /]
We have got the most important information. With this information we will find out the Volatility of Nifty from 01-04-2017 to 24-04-2017. Please note that to find out the Annualized Volatility you will have to take out one year closing prices. However since here I am just trying to explain how to find out Volatility, I am taking out only few days of closing prices.
To take out Volatility over a time we need to find standard deviation formula. You can use Excel to make this process easy. In simple math, Standard deviation is the degree to which the prices vary from their average over the given period of time.
See the image below, in Excel, the formula for standard deviation is =STDEV(from col no:to col no). The col no is the column which is used to keep the percentage change from the previous day.
See the image below:
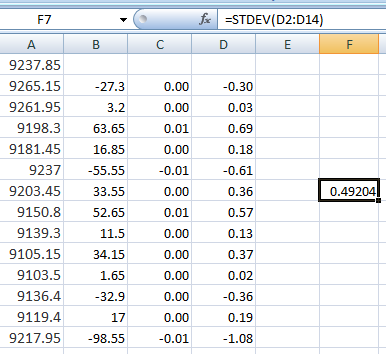
Standard Deviation Nifty April 2017
As you can see I have used the formula for standard deviation, =STDEV() and got the standard deviation as 0.49%.
This is daily standard deviation of Nifty from 01-Apr-2017 to 24-Apr-2017. Like this one can take out standard deviation of one year.
Calculating Annualized Volatility
We have got the standard deviation. To get the Annualized Volatility we need to multiply daily standard deviation by the square root of 252.
Why 252?
Because in one year almost 252 are trading days. Rest are weekends or holidays when the markets are closed.
This can be done in Excel. The formula for square root in Excel is =SQRT().
Square root of 252 is 15.87.
15.87 * 0.49 = 7.77%.
Based on the price movements from 01-Apr-2017 to 24-Apr-2017, Nifty Annualized Volatility is 7.77%.
Note: For very correct Annualized Volatility it is recommended take at least last 60 days closing. The Annualized Volatility is no guarantee that in one year the stock or Index will move only that much in a year, but it gives a rough idea that most of the time that will be the most movement. In our case 7.77% is Annualized Volatility of Nifty based on the period of Volatility from 01-Apr-2017 to 24-Apr-2017.
Can We Tweak This Data?
Yes Volatility can be found out for any time period. You can calculate Monthly Volatility or Weekly Volatility.
Traders looking to trade Bank Nifty Weekly Options can find out Bank Nifty Weekly Volatility.
For Monthly Volatility, get one months volatility, and multiply the daily volatility standard deviation by the square root of 21.
For Weekly Volatility, calculate the weekly percentage change for at least 5 weeks, and take the standard deviation of that data. To Annualize the weekly volatility, you will need to multiply by the square root of 52. One year has 52 weeks therefore multiply by the square root of 52.
Annualized Volatility Calculation Is It Worth It?
It is a mixed answer. Like I said Annualized Volatility is no gurantee that the stock will move only that much, however it gives a rough idea about the stocks movement. Some traders do take a trade based on Annualized Volatility. However there is no historical data if trades based on Annualized Volatility make more than 50% times profit.

Click to Share this website with your friends on WhatsApp
COPYRIGHT INFRINGEMENT: Any act of copying, reproducing or distributing any content in the site or newsletters, whether wholly or in part, for any purpose without my permission is strictly prohibited and shall be deemed to be copyright infringement.
INCOME DISCLAIMER: Any references in this site of income made by the traders are given to me by them either through Email or WhatsApp as a Thank You message. However, every trade depends on the trader and his level of risk-taking capability, knowledge and experience. Moreover, stock market investments and trading are subject to market risks. Therefore there is no guarantee that everyone will achieve the same or similar results. My aim is to make you a better & disciplined trader with the stock trading and investing education and strategies you get from this website.
DISCLAIMER: I am NOT an Investment Adviser (IA). I do not give tips or advisory services by SMS, Email, WhatsApp or any other forms of social media. I strictly adhere to the laws of my country. I only offer education for free on finance, risk management & investments in stock markets through the articles on this website. You must consult an authorized Investment Adviser (IA) or do thorough research before investing in any stock or derivative using any strategy given on this website. I am not responsible for any investment decision you take after reading an article on this website. Click here to read the disclaimer in full.

My student gets the Winner's Certificate of Zerodha 60-day Challenge - Click here and Open Stock Buy and Sell Free Account with Them Today!!!
 Testimonial by a Technical Analyst an Expert Trader - Results may vary for users
 60% Profit Using Just Strategy 1 In A Financial Year – Results may vary for users

 Testimonial by Housewife Trader - Results may vary for users
Comments on this entry are closed.
Dear Shaw,
Thanks for the article on Volatility.
Regards,
Srinivasan
Welcome
what is volatility cone?how annual realized volatility is calculated?
Volatility Cone is a technique for visualizing current option implied volatility relative to historic volatility at different maturity ranges. If we know nothing about direction, but are interested in the range in which it might move, then we can calculate the range in which it might stay with 95% probability for various different time periods. Thus we would look at all the weekly moves in our historical data set, and say what the 95% range was for the next week’s move. This is almost similar to moving averages as we do in stocks to predict the future move or at least the range for the short term.